Wei Luo is a PhD candidate in Geography at Pennsylvania State University and researcher in Penn State’s GeoVISTA Center. He’s also a good friend of mine from my own time at Penn State Geography. Yesterday, Wei presented his research on geo-social visual analytics to GCRI, exploring how this research applies to global catastrophic risk.
Visual analytics can be defined as “the science of analytical reasoning facilitated by interactive visual interfaces”. As an illustration of visual analytics, Wei recommends the video Precision Information Environments Envisioning the future of emergency management:
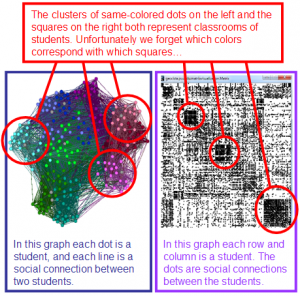
Wei’s research uses visual analytics to simultaneously explore geographic information and social network information. People in one geographic location are often socially connected to each other – but not always. Wei’s GeoVISTA group developed a tool called GeoSocialApp to help visualize these relationships. Here’s an example showing two different visualizations of social networks within a school, with clusters of social networks found in close geographic proximity: in classrooms.
Geo-social interactions are important for many situations. For example, an airborne infectious disease spreads to people in close geographic proximity, but infected people will travel to be around people whom they are close with socially. Simultaneously seeing the geographic and social realms and their interactions can help us understand the dynamics of disease spread, and in turn how to slow the spread.
The presentation prompted vigorous discussion. One topic that caught our attention was the application of geo-social visual analytics to vaccine allocation during pandemic disease outbreaks. The analytics can help identify which people are most important to vaccinate in order to minimize the spread of the disease. Superficially, this idea would seem to relate to existing research on optimal vaccine allocation, e.g. this paper. (Note: I haven’t read the paper or any other research on vaccine allocation. We’re just guessing that there may be a connection here.) Decisions about who gets to be vaccinated also raise profound moral and legal questions. This seems like a worthy area for inquiry.
Here’s the title and abstract for the talk:
Geo-Social Visual Analytics with Applications to Catastrophic Risk Management
This talk aims to explore the integration of geographic and social network perspectives on social processes in place from two levels: the theoretical level and the methodological level. At the theoretical level, this research develops a theoretical framework to integrate geographical context and social network context. At the methodological level, the integration of geography and social network contexts is framed within a new interdisciplinary field: visual analytics that is defined as the science of analytical reasoning facilitated by interactive visual interfaces. Two geo-social visual analytics tools are being developed to study the complex relationships between geographical context and social network context at different geographical levels: geographical region level (e.g., county, state, and country) and individual level. The first tool uses data for the international trade network among different countries to empirically study the interaction of spatial-social relationships across geographical regions at multiple levels of the network hierarchy. The second tool tightly integrates important network statistics relevant to disease transmission and control into appropriate visualization techniques, facilitating the exploration of human interaction network structures to design advanced control strategies. For each tool, this talk also discusses their potential applications to catastrophic risk management.
Here’s some related work on disease spread showing simulations of worst case scenarios for H1N1 (swine) flu, from Dirk Brockmann of Northwestern University:
See also Ferguson et al. 2005, Strategies for containing an emerging influenza pandemic in Southeast Asia, Nature 437, 209-214.


